


GUEST POST BY WISEGUYS MARKETING’S BRUCE GREGOIRE

Courtesy Pixabay | Geralt
Veteran marketers may remember The Doors – with lead guitarist Jim Morrison and band, one of their biggest hits was “Love Me Two Times…”
“Love me two times baby / Love me twice today / Love me two times / girl I’m goin’ away…”
Now stop humming for a moment – this isn’t time for Karaoke! It’s time to discover how often your customers are loving you just one time, and never again.
If you suspect you have way too many one-time buyers, you are not alone.
Throughout our 20 years of experience browsing customer data files, it still often shocks us to see the prevalence of one-time buyers. In fact, as many as 80% of all customers fall into this category.
Not a pretty sight.
It’s no secret that customer retention rate is one of the best measures of customer loyalty. A wise marketing consultant once said that you can’t really call a first-time buyer a “customer” until the 2nd purchase. Up to that point, they may just be a “tire kicker.”
Who Loves You, Baby?
- How do you know more about your customer retention rate?
- Have you taken the time to figure this out?
- Do you know there is an easy, seamless way to calculate this number?
There is! Let’s calculate your Lifetime Customer Retention rate, by browsing your M.O.M. CUST table.
Lifetime Customer Retention Rate Calculation:
- Open your M.O.M. Cust table.
- Filter the table for Bill-to records only (“B” in the ADDR_TYPE field) – but suppress new customers in the last 12 months. Record that count.
- For Bill-to’s, filter a 2nd time for a count of repeat buyers (“2 or more” in the ODR_FREQ field), with the 12 month suppression intact. Record that count.
- Divide the number of repeat buyers into the total number of “Bill-to” customers. That ratio (converted to a percent) is your “Lifetime Retention Rate.”
Lifetime Retention: Is that helpful?
The Lifetime Retention calculated above is simply the percent of all customers who became multi-buyers in their lifetime.
This may be valuable to you, or not. As we pointed out in our Near Term Value blog in April, most marketers cannot wait a lifetime to establish the profitability of a customer. Thus, a shorter window of time is much preferred. Which brings up a discussion of buying cycle.
Buying Cycle: It gets complicated
If a lifetime is too long, perhaps you prefer “average buying cycle”?
Knowing the average buying cycle of your customer base (e.g. 2 years) can give you a point in time beyond which a customer could be considered “at risk to lapse.” And from that milestone, you can calculate your “Buying Cycle retention rate.”
Two predictable buying cycles come to mind – consumables and seasonal products.
For consumables, think about selling dog food to a customer, on average, every month. Would a one-month buying cycle be appropriate for measuring repeat dog food buyers? Likely yes – and those consumers could be easily tracked when they lapse over time.
You may think this would also be true for seasonal buyers – perhaps lawn products in the spring, or gifts over the Christmas holidays. For certain product lines, this may be workable, but the seasonal + non-seasonal mix of purchases would distort your overall retention tracking.
Unfortunately, for strictly random purchase scenarios, we have also found that calculating an “average buying cycle” is not helpful. When we plot buying intervals (X axis) versus frequency (Y axis), what we typically see is not a bell shaped curved – which indeed would be helpful in establishing an average. Instead, the number of short purchase intervals is disproportionately higher than longer intervals. This makes an average buying cycle meaningless.
Solution: Keep it Simple
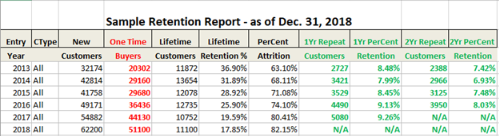
We recommend a scheme shown in the display below.
- Avoid buying cycle – simply calculate repeat customer counts for both 1 year and 2 year time horizons (results shown in green below). This is done as follows …
a. Eliminate the “suppress new customers in the last 12 months” criteria in steps 2-4 above.
b. Then count the repeat buyers within a 1-12 month window from the entry year. Repeat for a 13-24 month window from the entry year. - Lifetime Retention % – note below that this decreases year over year, which is expected as recent customers have a shorter time horizon to repeat.
- New Customers – note the N/A designation for years 2017 and 2018. Again, they haven’t had enough time to escape the one-time buyer category. Most will need more time.
Summary: Invest in retention reporting
Your M.O.M. database has all the data necessary to calculate customer retention. Turn the data geeks in your organization loose on this project. If necessary, hire the right consultant for this important project. Our staff at WiseGuys Marketing are at-the-ready if you need help.
Next up in our series, we’ll discuss how to boost your retention rate to maximize your profits. If you are ready to learn more about calculating purchase frequency, smile.io has a great piece on the topic.
Bruce Gregoire is Founder and CEO of WiseGuys Marketing, based in Falls Church, VA. He is also a guest speaker on CRM in the graduate marketing department of the Carey Business School, Johns Hopkins University. Since 1998, Bruce has assisted more than 100 clients – many with the Freestyle platform – with their database marketing needs.
WiseGuys Marketing
Cell (703) 282-5774 or office (703) 941-8109
BruceGregoire@WiseGuysMarketing.com